RAG Evaluation Guide
This document provides a step-by-step guide to setting up and running a RAG Evaluation using Vectorize.
Create the RAG Evaluation
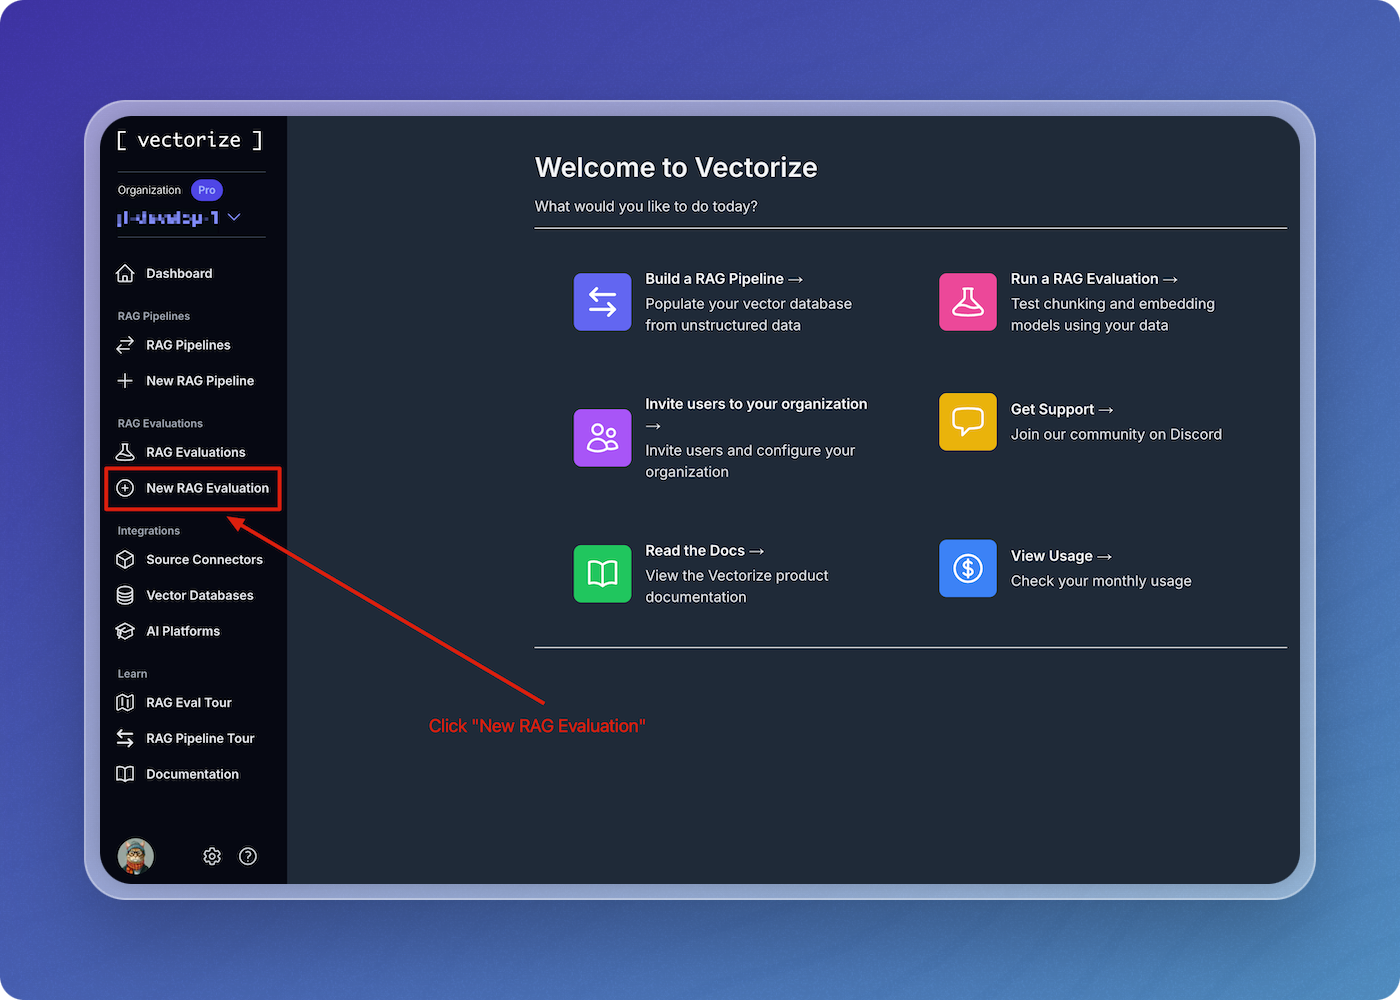
Navigate to "New RAG Evaluation"
From anywhere in the Vectorize console, begin by clicking on the "New RAG Evaluation" button in the left-hand menu.
Create New RAG Evaluation
-
Download the Whitepapers data.
Download the
whitepapers.zipfile from the following location:Download: Whitepapers (ZIP file)
After downloading the
whitepapers.zipfile, extract it to a location on your local machine. On most operating systems, you can do this by right-clicking the zip file and selecting Extract All or Unzip. -
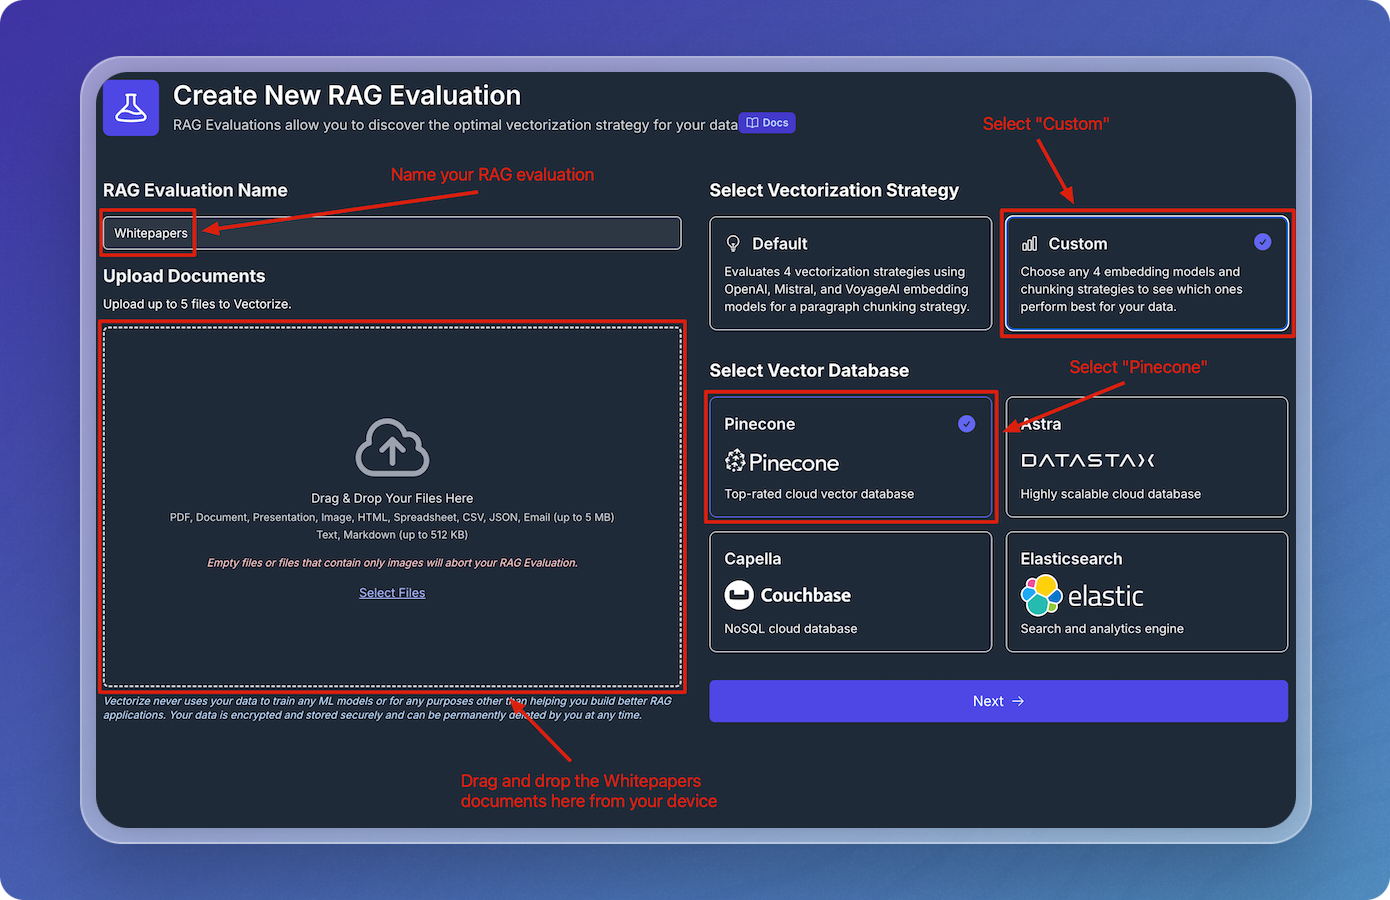
Name your RAG evaluation, select a vectorization strategy, and upload your documents, then click Next.
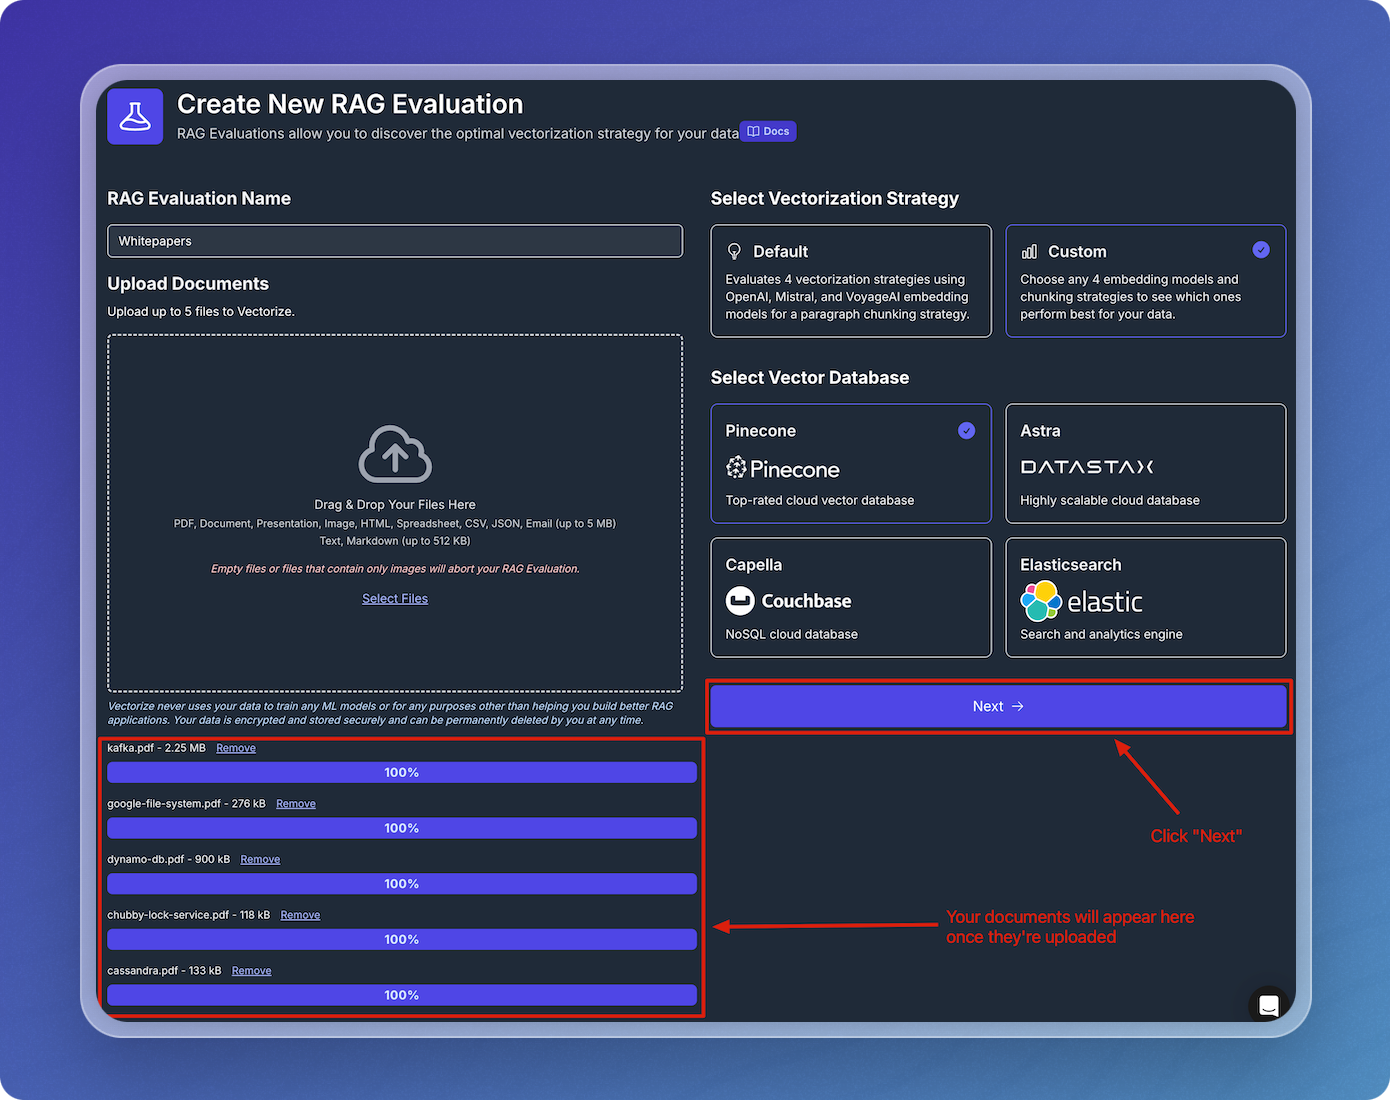
Verify Uploaded Documents
Once you've uploaded your documents, verify that you see them in the list of uplaoded files.
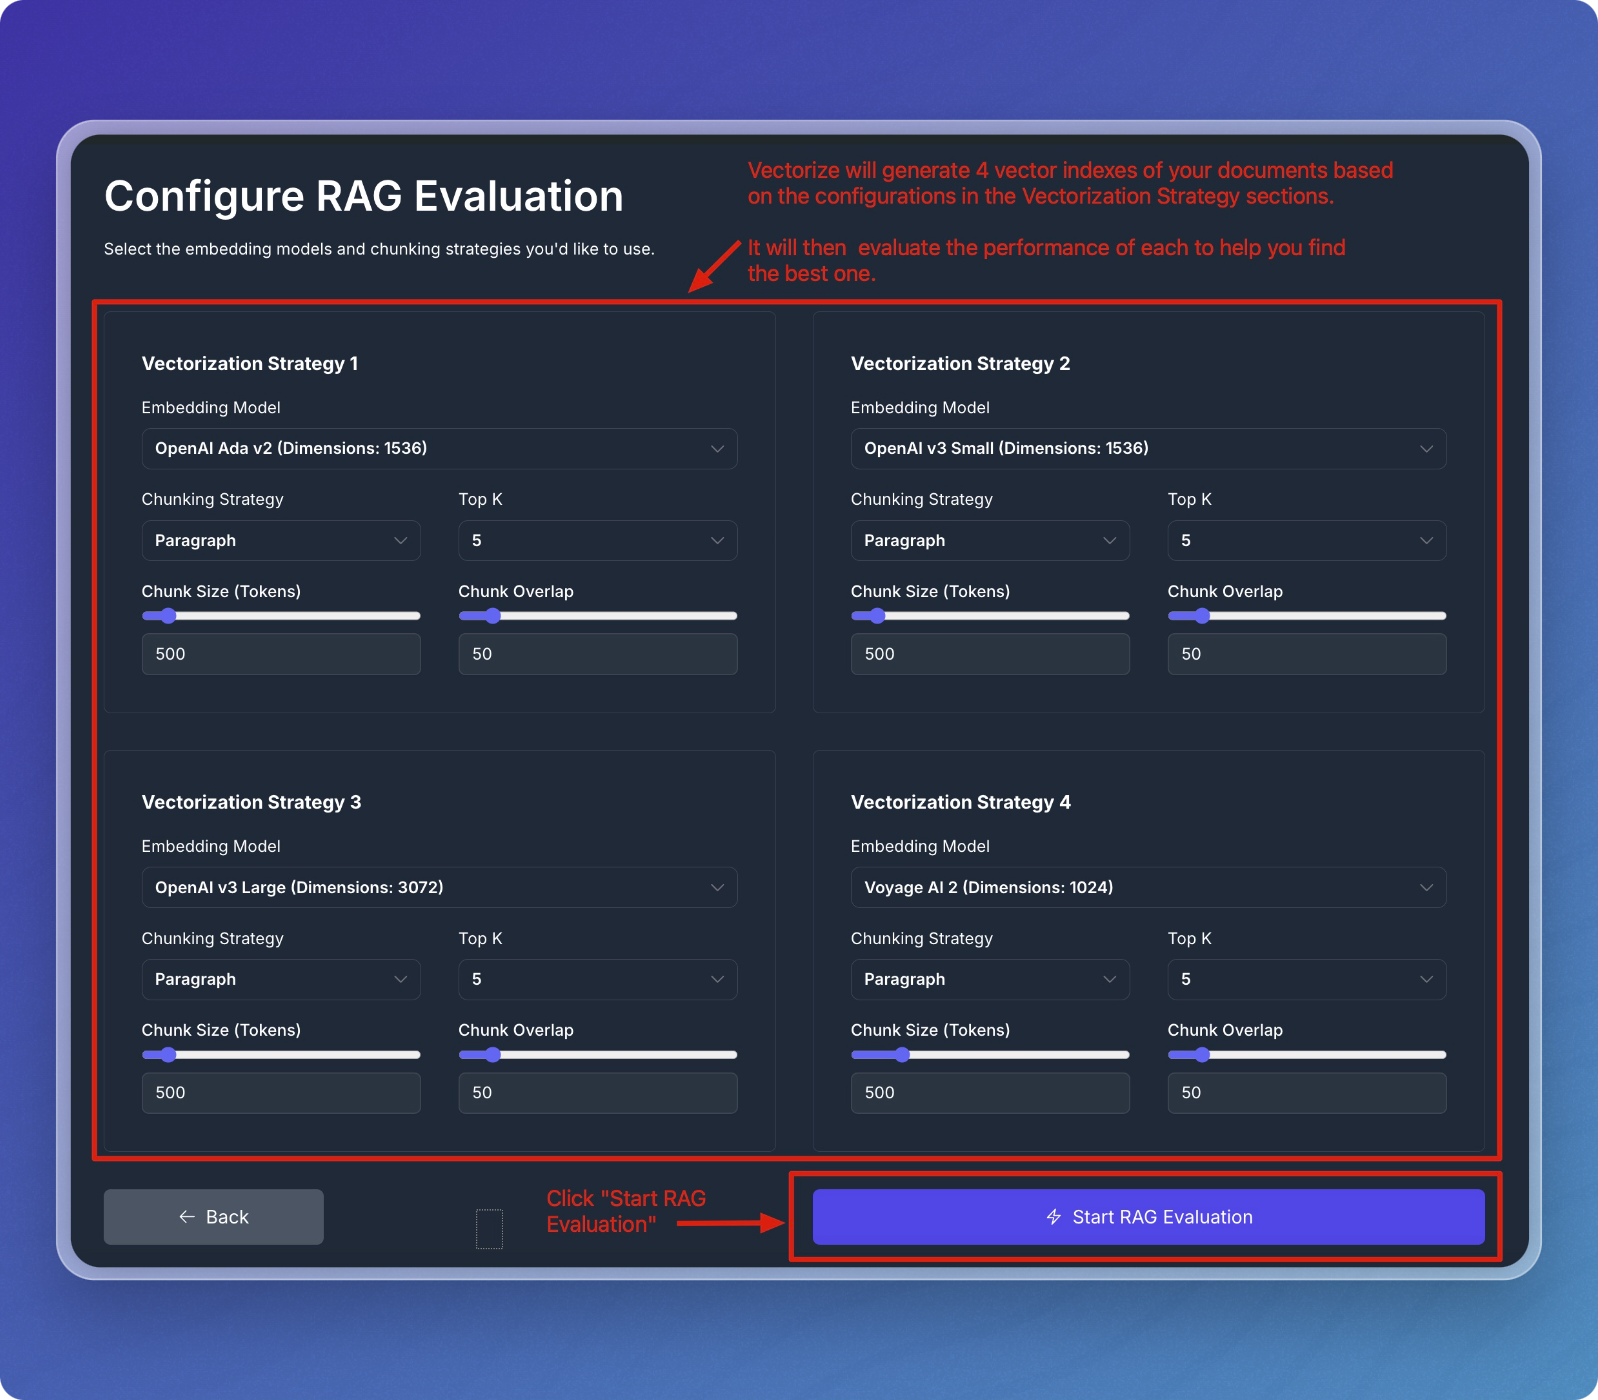
Configure RAG Evaluation
Configure the vectorization strategies by selecting embedding models, chunking strategies, and setting other parameters. For this quickstart you can just leave the default values, but if you're feeling adventurous feel free to adjust the settings to customize your evaluation.
Execute the RAG Evaluation
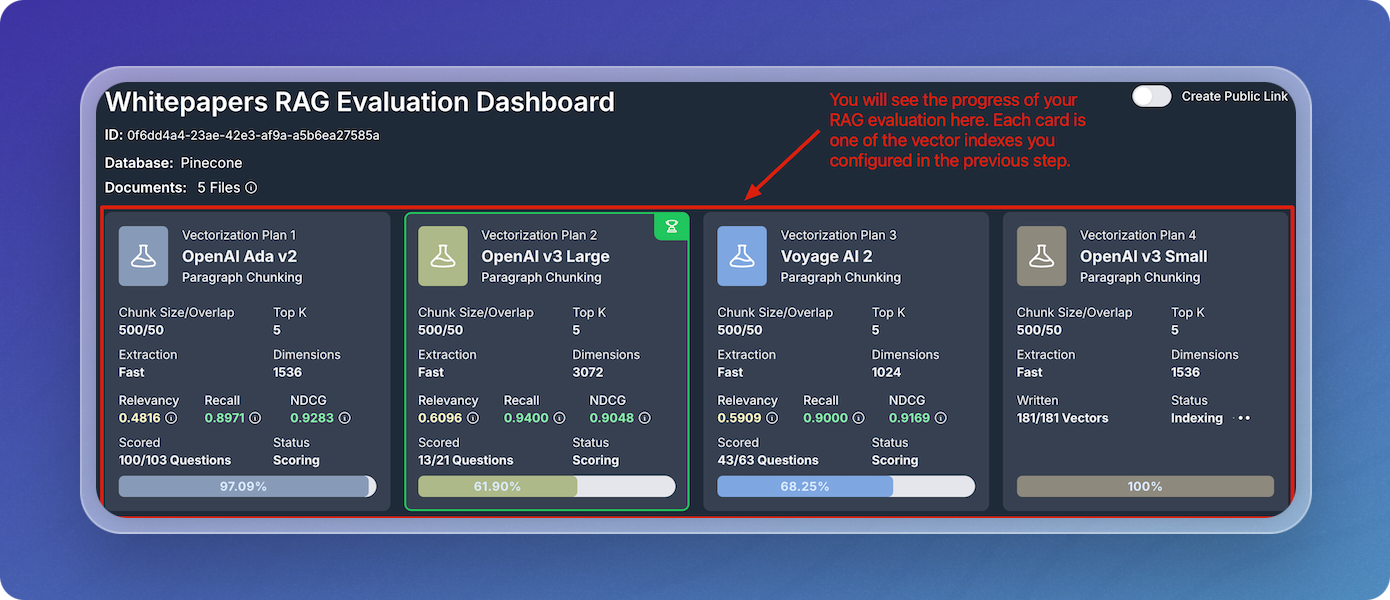
Monitor Progress
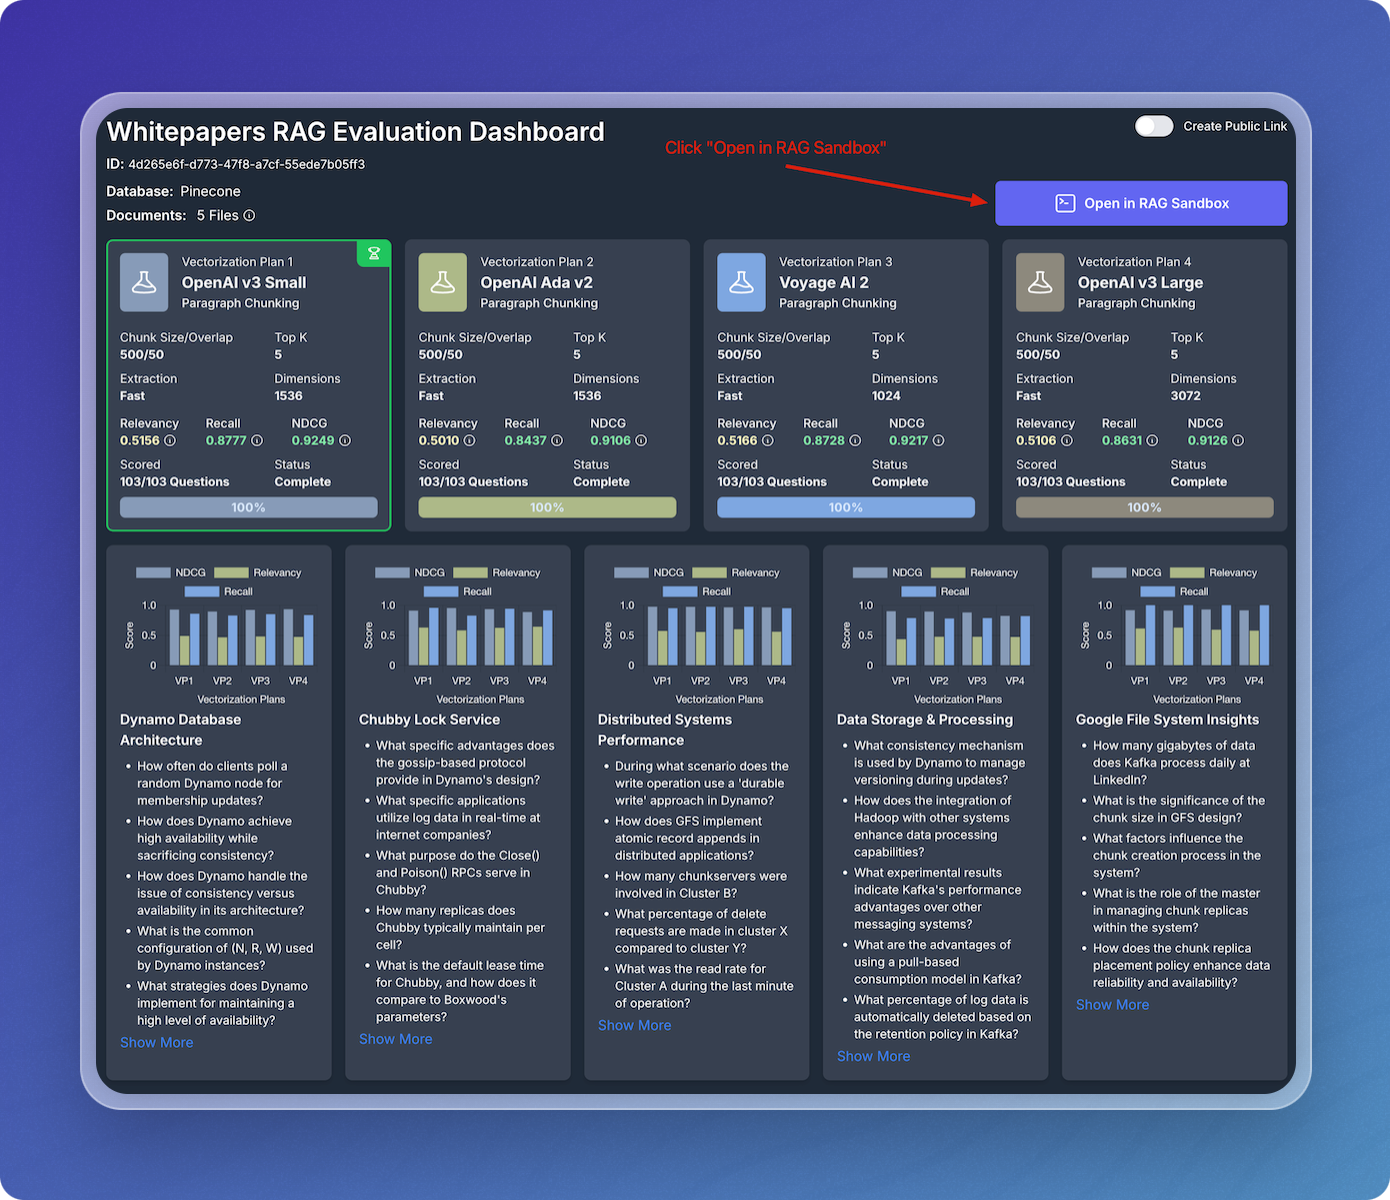
Once the RAG evaluation begins, you can monitor the progress of each vectorization strategy by inspecting the four cards along the top of the experiment.
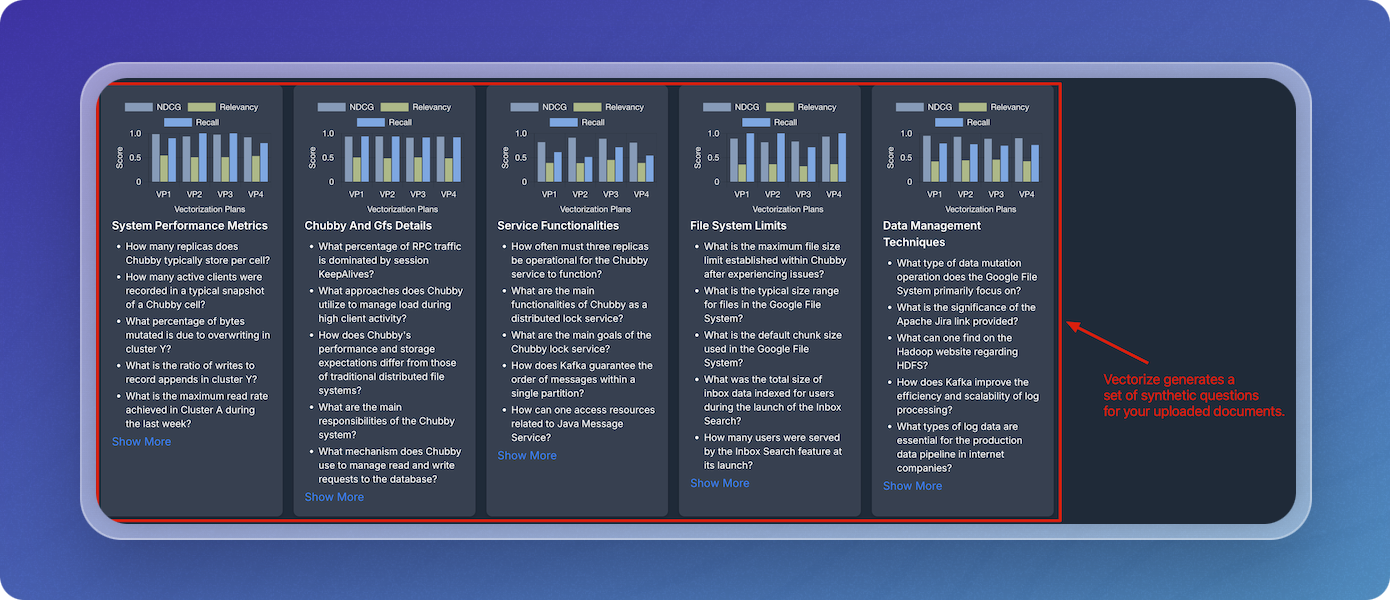
View Synthetic Questions
The system generates synthetic questions based on the uploaded documents. You can view them on the dashboard.
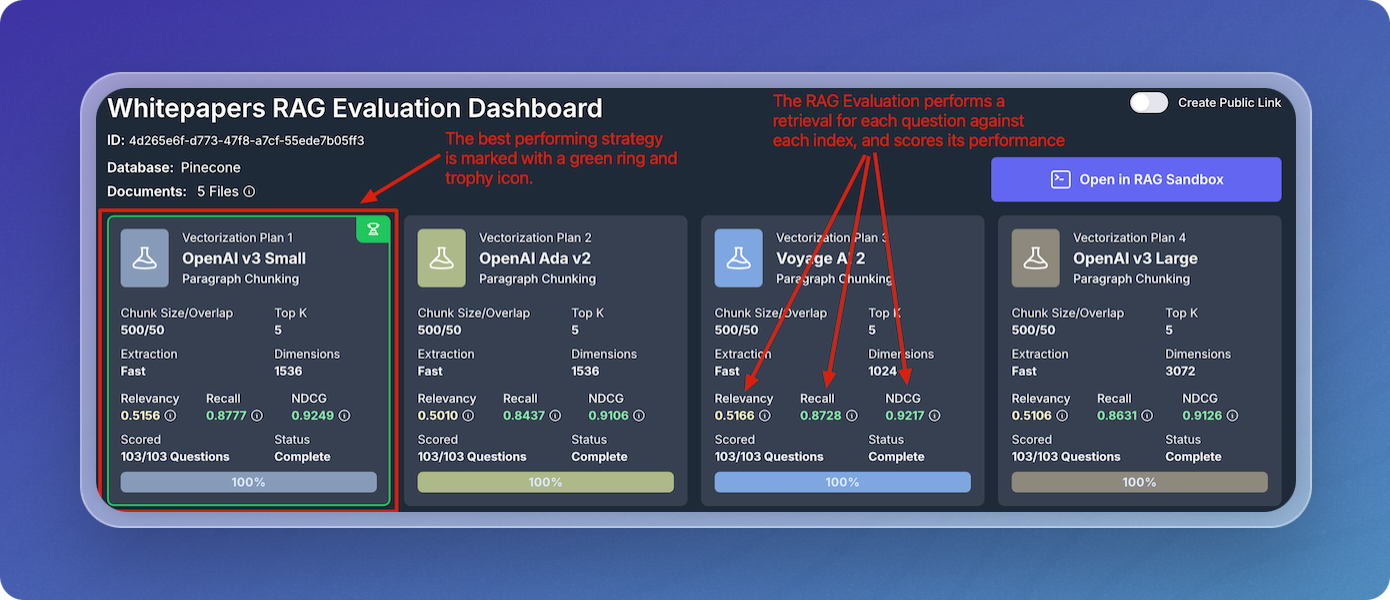
Evaluation Results
To score the performance of each vectorization strategy, the RAG evaluation retrieves answers to the questions using each of the vector search indexes. The scoring usese a combination of Context Relevancy, Recall, and Normalized Discounted Cumulative Gain (NDCG). The strategy with the highest scores is marked with a green ring and trophy icon.
Explore the Results in the RAG Sandbox
Open in RAG Sandbox
Click on Open in RAG Sandbox to explore the results in detail. The RAG Sandbox allows you to evaluate the performance of your search indexes using an end-to-end RAG flow. This gives you a qualitative evaluation based on your own personal assessment to complement the quantitative assessment provided in the RAG Evaluation dashboard.
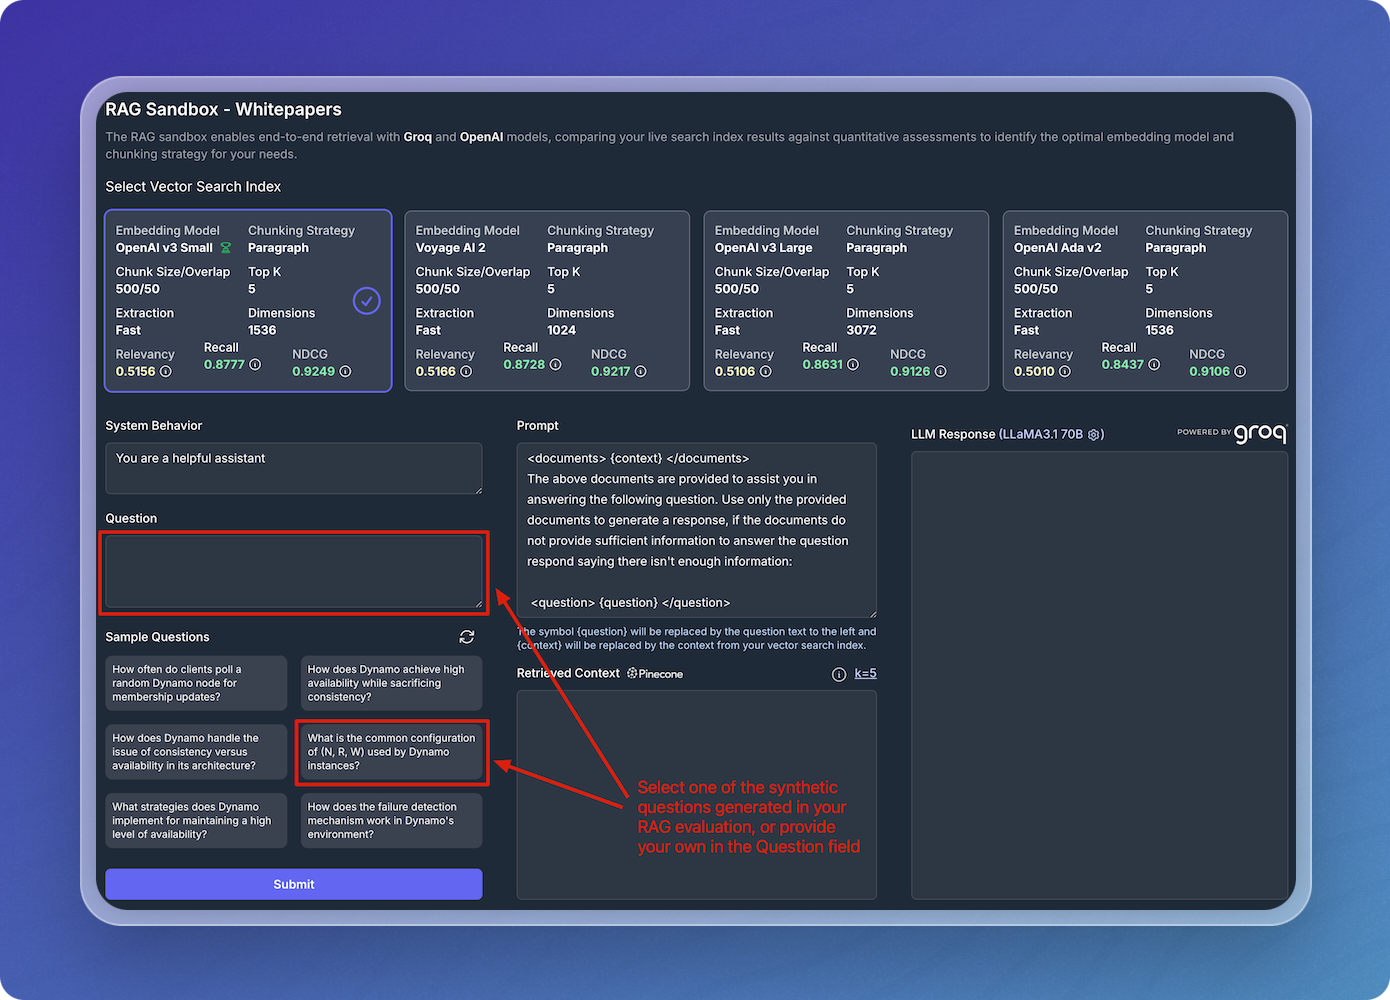
RAG Sandbox Interface
In the RAG Sandbox, select one of the generated questions or input your own to test the RAG system's responses.
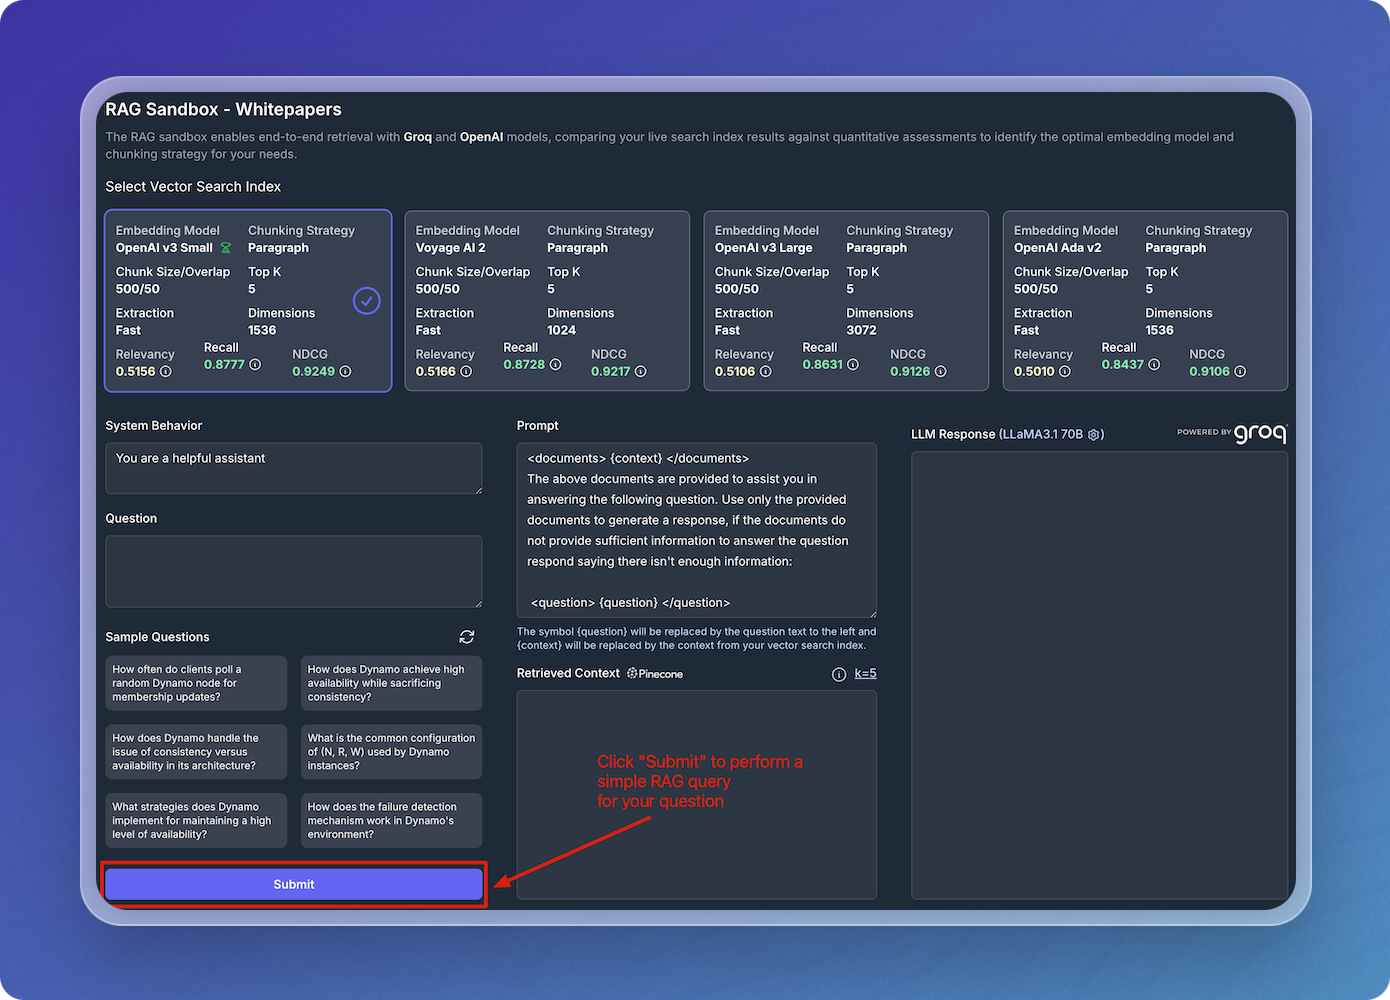
Perform RAG Query
Submit the query to see how the system retrieves relevant information from your vectorized documents.
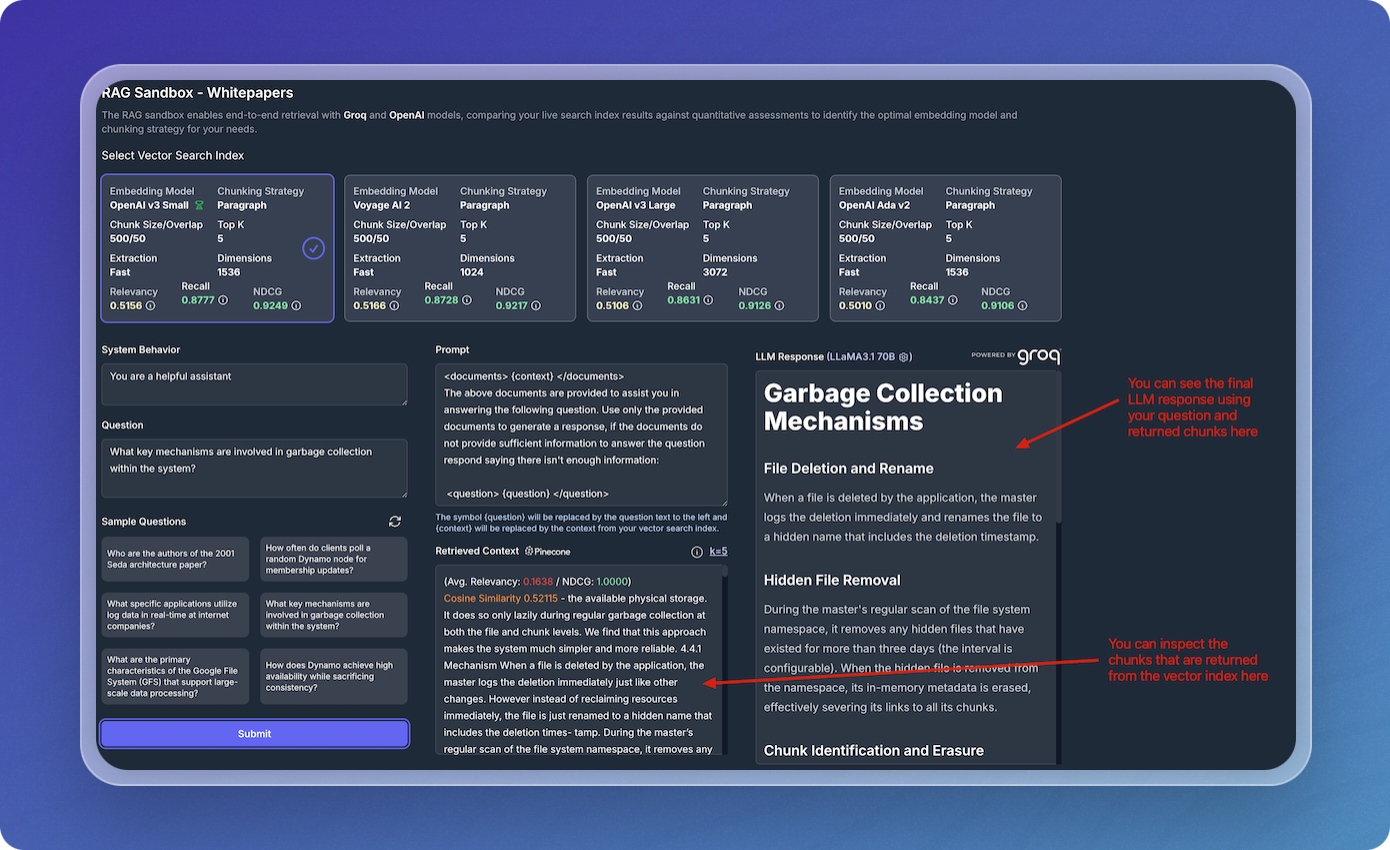
View the LLM Response and Chunked Data
After submitting a query, the LLM response is generated and displayed based on the returned chunks of your vectorized data. This allows you to see exactly how your data is retrieved and which specific chunks contributed to the answer.
Inspecting both the LLM response and the vector chunks provides transparency in how the system derived the answer. It helps you understand the strengths and weaknesses of the current setup, ensuring that the system retrieves the most relevant sections of your documents.
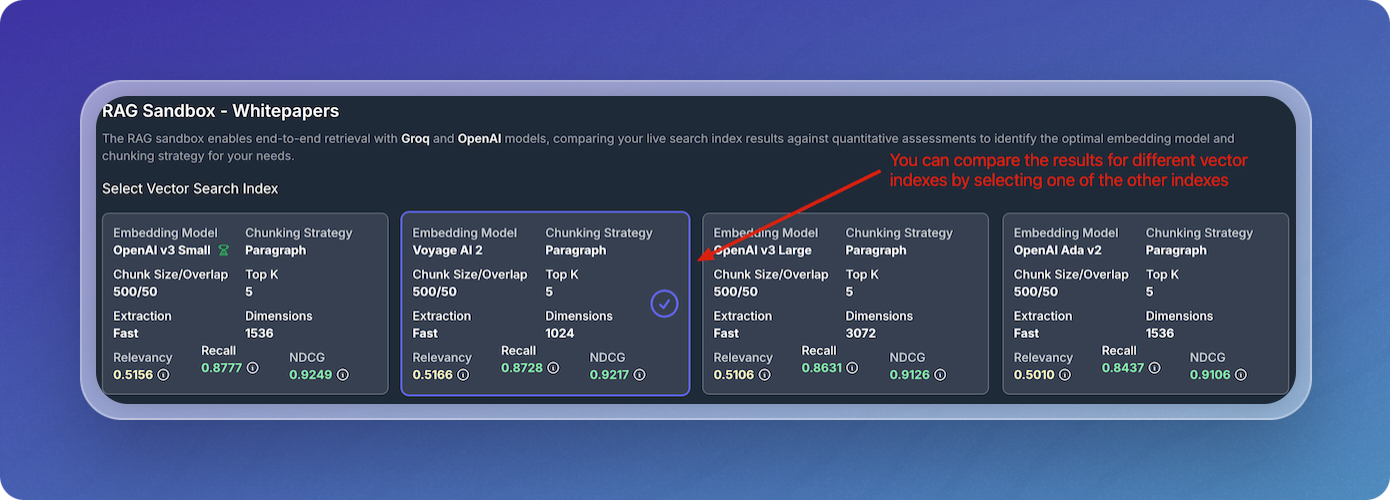
Compare Results Across Vector Indexes
The Sandbox allows you to compare results across different vector indexes (embedding models and chunking strategies) to see how they perform under the same query. You can select different indexes to view and compare their results, providing insight into which configuration yields the best performance.
This comparison ensures that you're using the optimal combination of embedding models and chunking strategies. By evaluating performance across various indexes, you can make informed decisions about which configuration works best for your use case.